Every new major release of Chrome, I check the release notes, and this time I got super excited to see “Recorder” being added.
This feature can be used to record, replay and measure user flows! End-to-end testing in the browser.
Doesn’t that sound amazing? 👏
Finding the Chrome DevTools Recorder
To find the recorder, you first open up the Chrome DevTools.
Mac
Cmd+Shift+Cor Windows:Ctrl+Shift+C.
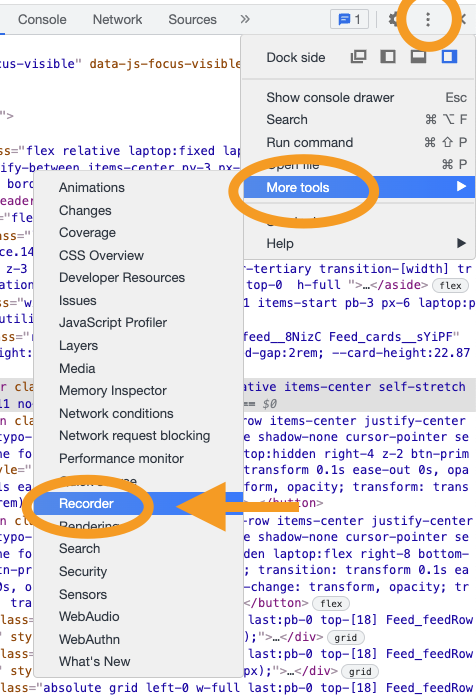
Then you can click on the “More options” button, find the “Mote tools” dropdown, and search for “Recorder”.
Once you open the recorder, it will have some details on how it works.
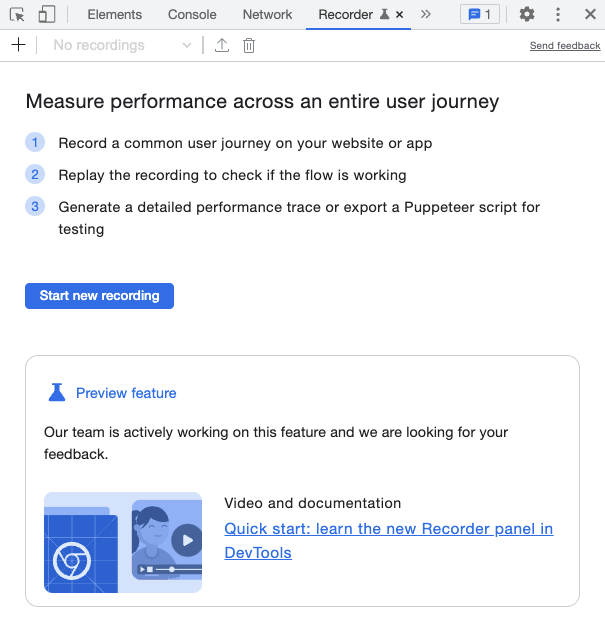
So basically, we can define user flows that we can re-test over time. This is great for testing essential flows in the application. And more importantly, measure if they did not deprecate performance in new versions.
I’ll be using daily.dev as my guinea pig for testing user flows.
I will be testing the flow of switching between feeds, adjusting the feed settings, and clicking an article, after which we can upvote it.
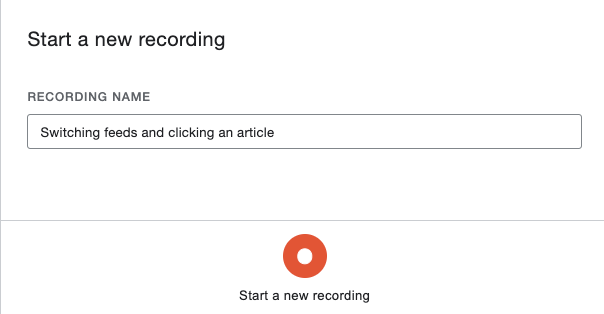
In the recorder panel, click the “Start new recording” button.
It will ask you to give the recording a new name; at the bottom, there is a big red button to start recording.
Once you hit the record button, you can click the elements you want.
And once you are done, hit the “End recording” button at the bottom of the recorder panel.
Once you are done, you should see your actions in a neat overview.
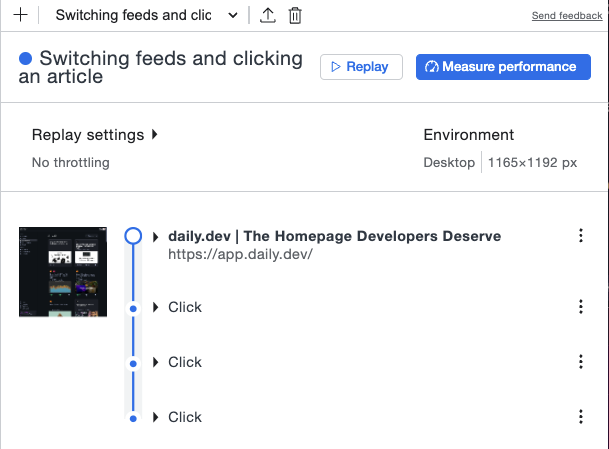
From here, you will be able to “Replay” the recording.
This will look through each step to see if the flow still works. Remember, this recording will stay here so you can test it over time.
Another thing we can do here is to click the “Measure performance” button. This will loop through the flow you defined and measure that specific recording as you might have seen before in the “Performance” tab.
I find it amazing that we now have a browser to test user flows and even measure those specific flows over time.
Bonus things
We can now do some cool bonus things with this recorder panel.
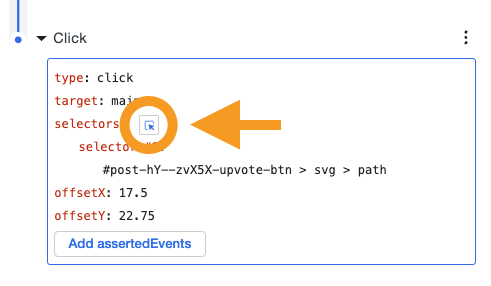
First, we can manually change selectors by using the little select icon for each event.
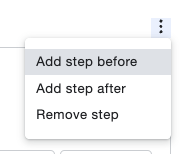
The next thing we can do is manually add specific events to our workflow.
Another thing we can do is define a throttle setting for the replay, which is excellent if you want to test out slow connections, for instance.

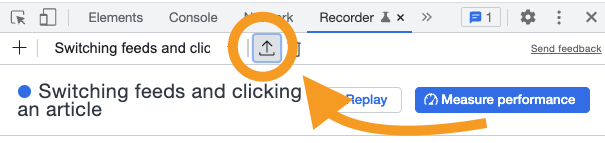
And last but not least, we can export a recording. This will generate a Puppeteer script you can further modify and use.
Let me know what you think of this new feature.
Thank you for reading, and let’s connect!
Thank you for reading my blog. Feel free to subscribe to my email newsletter and connect on Facebook or Twitter