I love how the Chrome dev team keeps making it easier and easier to identify potential issues on websites. Everything with improving speed and user experience.
The latest addition to these incredible tools is the “CSS Overview”. This new feature is available as a preview in Chrome 96
Using the Chrome DevTools CSS Overview
First, we need to open the Chrome Dev Tools.
Mac
Cmd+Shift+Cor Windows:Ctrl+Shift+C.
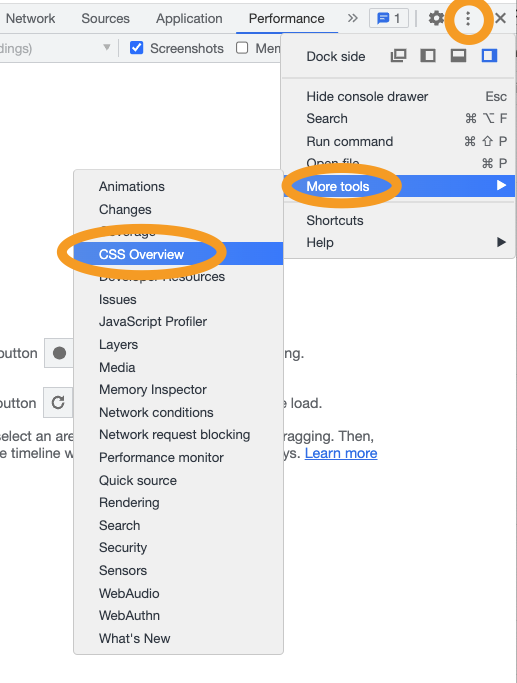
Then click the “More options” button find, “More tools”, and click CSS Overview.
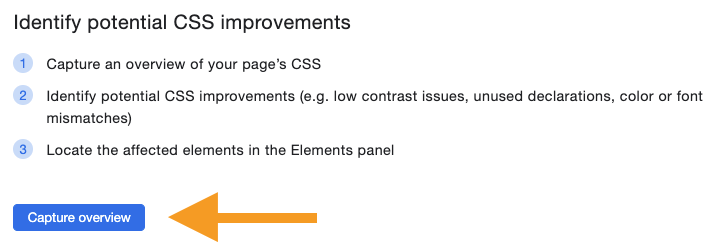
Once you open the tool, you’ll be prompted with an overview and some explanation of what it does. Click the capture button to start.
Once the tool is done, you’ll see a mix of things returned. I’ll break them down per chapter.
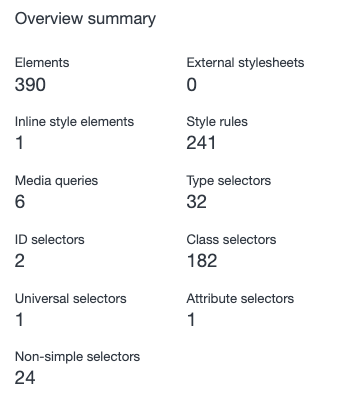
Overview summary
This high-level overview quickly shows you how many elements are found and how many selectors and stylesheets there are.
Colors
Then we get the colors panel, which shows all colors found on the page. This overview gives you a quick example of whether these colors match your brand colors.
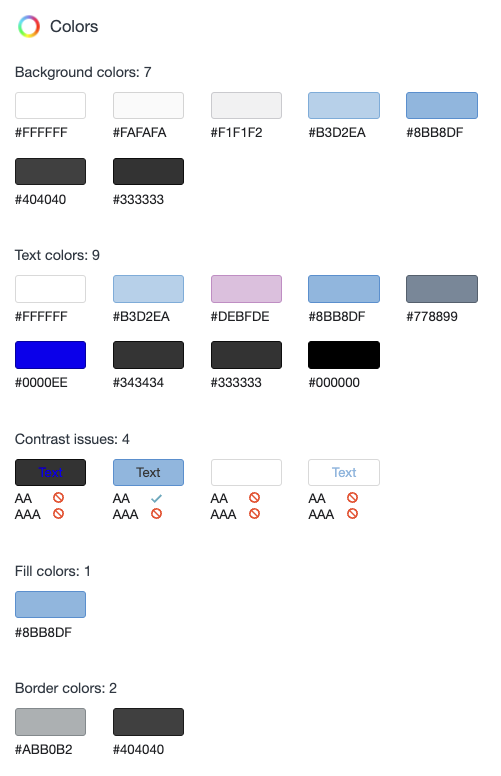
And show possible contrast issues.
The cool thing here is that you can click on each element to see all occurrences in the stylesheet.
In the image below, I clicked the #DEBFDE color, and you can see all elements that have this color.
You can then press each element to highlight it in the DOM.
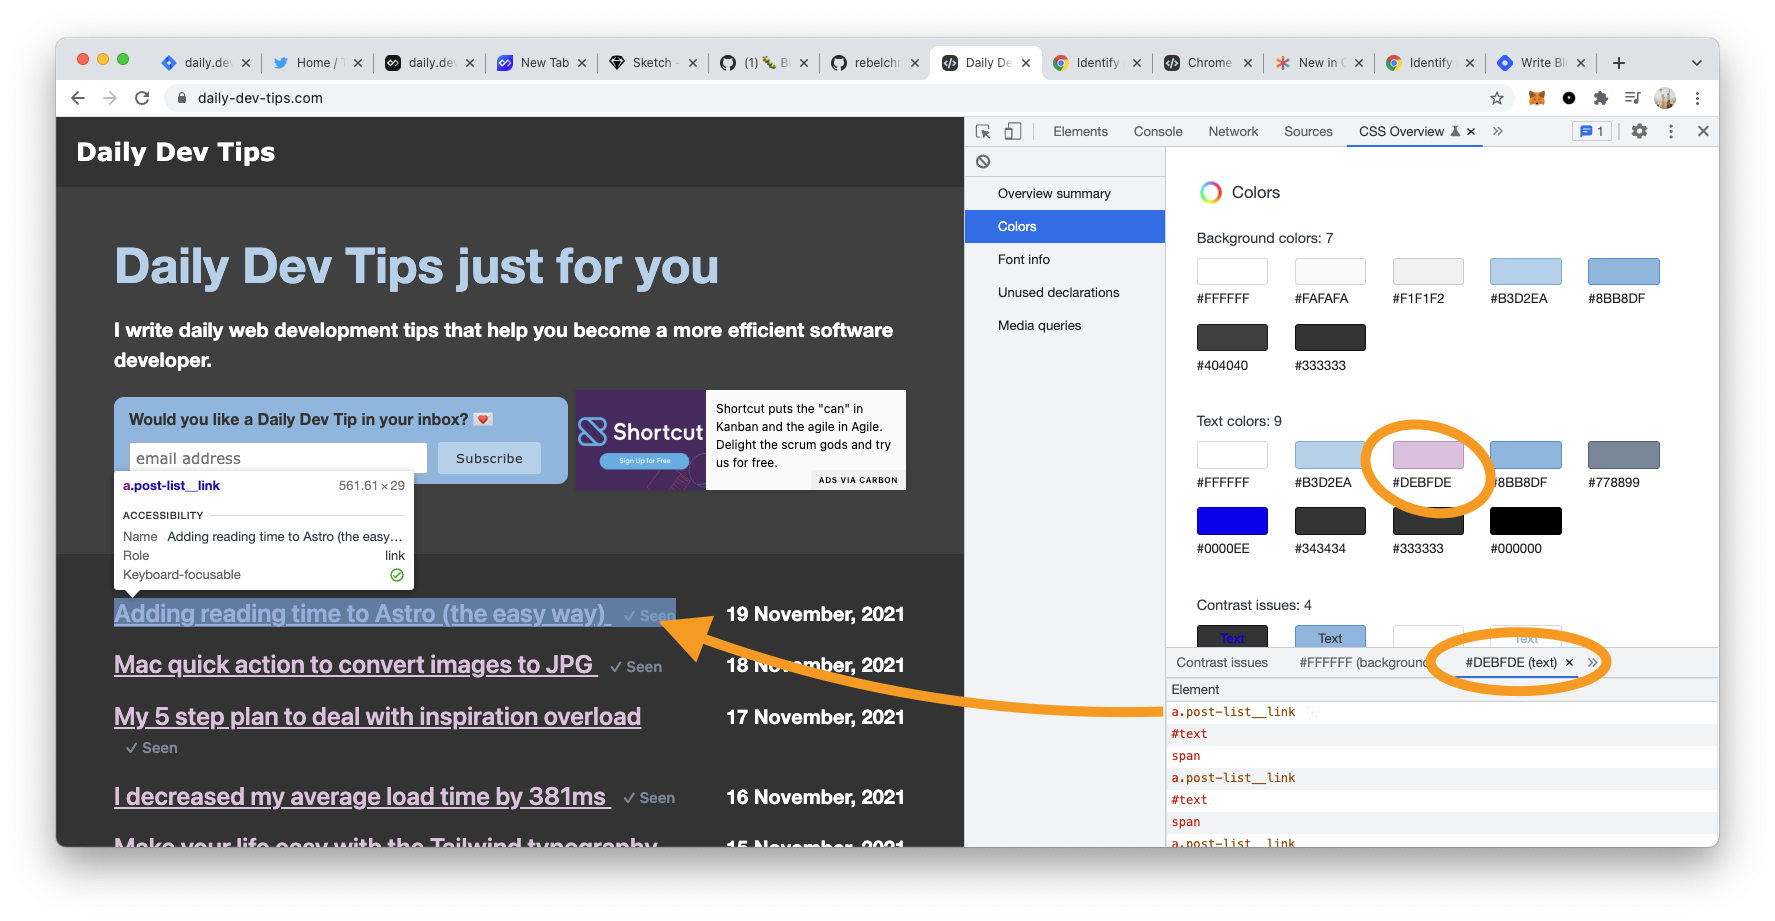
Really find this a welcome addition to quickly see unwanted color styles, like white on white or hidden elements.
Font info
Then we enter the font overview panel, which shows all fonts you use on the page and their style.
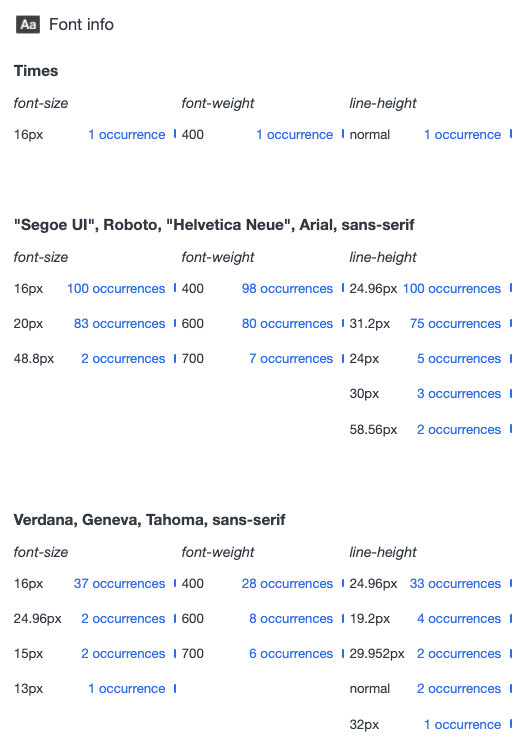
I actually noticed through this tool that I’m assigning different fonts on top elements, causing the font issue to go a bit wild.
Again, super easy to quickly identify weird are one-of-a-kind font sizes that might not be in line with your brand.
Unused declarations
Then we have a panel on unused declarations, making it easy to find styles that will have no effect.
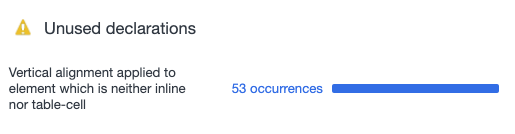
In my case, it’s a pseudo selector setting vertical-align on an element that’s not inline or a table-cell.
(This particular case is actually valid, so I will log this with the DevTools team)
Media queries
And then, we get an overview panel for our media queries. This makes it super easy to find all your queries.
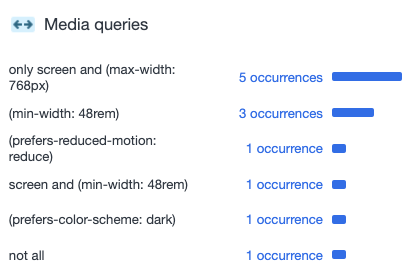
Including screen sizes, preferred schemes, and more. You might find elements to optimize and combine queries that are about the same size.
Conclusion
I hope you enjoy this tool as much as I do. I really like to revamp my CSS to be smaller, more inline, and brand correct.
And this tool definitely helps with that 🎉.
Thank you for reading, and let’s connect!
Thank you for reading my blog. Feel free to subscribe to my email newsletter and connect on Facebook or Twitter